Monday, 17 November 2008
Going Long Nikkei
Just updated my portfolio page with my Nikkei long position that I took on this morning's open. See more on that signal in Friday's post. Good luck this week!


Friday, 14 November 2008
Japan Turning Up? And Maybe Gold Too
A few interesting new signals from this afternoon's Commitments of Traders data for my trading setups: long Nikkei and gold, short copper and cash for the BKX U.S. Bank Index. All those signals are for execution on Monday's open, except for gold, which setup works with a two-week trade delay, so execution is for Dec. 1. Check my latest signals page for all the details. The new copper signal I will ignore because of my Highly Correlated Markets Rule, which says I'll take a new signal in a group of correlated markets if the majority is giving the same signal. In the case of copper, that's not the case. My system is long crude and silver but short gold, while platinum is in cash. Also, as of Monday, my Black Swan Rule expires, which means I am back to trading new signals. Confused? See more about how all this works at my intro page and glossary page and more on my risk-control rules at my how it works page. Have a great weekend. Also tune in next week for an update to my S&P 500 trading setup. I've been tweaking my evaluation method for choosing best setups and am starting with a new, improved one for SPX.
TAGS: Nikkei, gold, BKX, Bank Index, copper, S&P 500, SPX, COT, Commitments of Traders, derivatives, Black Swans, market timing, trading system development, CFTC, Commodity Futures Trading Commission, COTs Timer, out-of-sample testing, walk-around testing
TAGS: Nikkei, gold, BKX, Bank Index, copper, S&P 500, SPX, COT, Commitments of Traders, derivatives, Black Swans, market timing, trading system development, CFTC, Commodity Futures Trading Commission, COTs Timer, out-of-sample testing, walk-around testing
Monday, 10 November 2008
Triple Your Losses!
Tom Bulkowski blogs about a bunch of new triple-leveraged ETFs now available. Read more here.
Natural Gas: Nice Patch of Resistance
Hope you had a good weekend. Just noticed this morning that natural gas jumped right up to resistance at the earlier highs of Oct. 20, Nov. 4 and Nov. 5 and at the Tom DeMark sell line on the 15-minute chart. Now it's selling off again. Wow - nice patch of resistance around $31.25. If it breaks out, I'll consider a short-term trade.
Friday, 7 November 2008
Natural Gas Bullish
I've been watching natural gas closely in the past few days for a possible technical trade while my Black Swan Alert remains in place for one more week for my COTs Timer trading system. Natural gas has tested resistance around the Oct. 20 and Nov. 4 and 5 highs and is forming a possible base after its huge selloff. There's also a nice seasonal sweet spot for Alberta natural gas from July to December, and that could finally kick in late this year. (See more on that here.) Turns out this afternoon's Commitments of Traders data has given my natural gas trading setup a bullish signal for execution on next Monday's open - the only new signal from today's data. (See my updated latest signals table here.) I won't trade the COT signal due to my Black Swan Rule. (See more on that rule here.) But I might consider a short-term trade based on price action if there's a nice breakout. The recent highs also happen to coincide with breakout levels based on the Tom DeMark system, about which you can read more here. Have a relaxing weekend.
TAGS: natural gas, COT, Commitments of Traders, derivatives, Black Swans, market timing, trading system development, CFTC, Commodity Futures Trading Commission, COTs Timer, out-of-sample testing, walk-around testing
TAGS: natural gas, COT, Commitments of Traders, derivatives, Black Swans, market timing, trading system development, CFTC, Commodity Futures Trading Commission, COTs Timer, out-of-sample testing, walk-around testing
Friday, 31 October 2008
Bullish for 13-Week T-Bill
Just updated my latest signals page. Very, very quiet this week. Just one new signal: bullish for the 13-week T-Bill (meaning the setup is calling for the yield to fall). Hope you had a good week and that you have a nice weekend. Happy Hallowe'en!
Thursday, 30 October 2008
Falling T-Bill Yield Points to Sickly Market Action
Many days, there's a good tell that helps give guidance to the tone of the market. Sometimes, it's been important to watch the VIX Volatility Index. In the past few days, I often find myself looking at the 3-month Treasury Bill yield (symbol $IRX on StockCharts.com). Yesterday, it plummeted most of the day - despite the Fed move. Today, it's continued its steady collapse all day. See a daily chart here. (The intraday chart, available to subscribers, shows what I'm saying better.) Not a good sign.
Tuesday, 28 October 2008
The Little Bounce That Couldn't
Looked like a nice bounce coming into the open, but it's fading pretty fast. Two good tells right now are the HGX Philadelphia Housing Index, which quickly broke below the lows of yesterday and last week, and the ratio between the 200-percent leveraged UYG ProShares Financials Fund and the BKX Bank Index (which you can view in StockCharts.com by using the symbol UYG:$BKX). The latter is a way to check sentiment by seeing how the leveraged fund is doing short-term against the index. UYG:$BKX also quickly broke down this morning. Good luck this week.
Monday, 27 October 2008


Friday, 24 October 2008
Nikkei to Cash, Gold Bearish
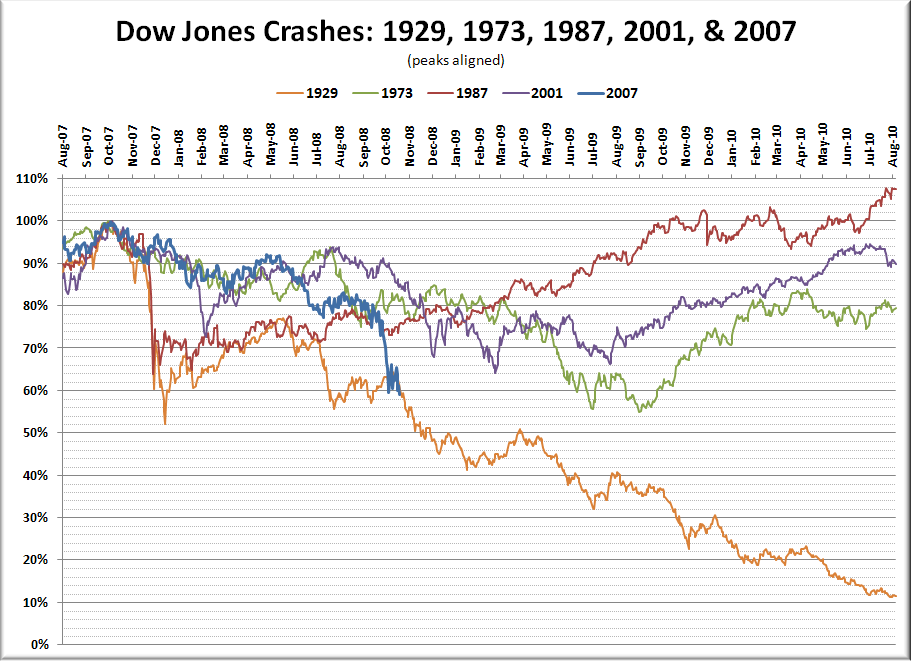
Sheesh. Hope you survived the week in one piece! We're just 100 points on the S&P 500 from the Oct. 2002 low of 777. Amazing. Below that, support is sketchy on the charts. Mark Arbeter, chief technician at S&P's Equity Research, just wrote in a note that there's a support line off the 1932 lows - that's right, 1932! - around 600 to 700. His colleague, Sam Stovall, chief investment strategist at their shop, says when the S&P 500 has retraced over 61.8 percent of the prior bull, the full giveback was 96 to 119 percent, with an average of 110 percent in the five instances since 1929. That would equate to a move to 700 on the S&P 500 - though the small sample size doesn't give us much validity statistically speaking.
My latest signals table is now updated with the latest data based on this afternoon's Commitments of Traders report, which my trading setups are all built around. New signals: Nikkei goes from bearish to cash, and gold goes to bearish. Please note that my new Black Swan Risk-Control Rule is now in effect for all my trading setups based on the Commitments of Traders data issued weekly by the U.S. Commodity Futures Trading Commission. (See my "How It Works" page for details.) Trading new signals will resume Nov. 17. Have a good weekend.
TAGS: S&P 500, gold, Nikkei, COT, Commitments of Traders, derivatives, Black Swans, market timing, trading system development, CFTC, Commodity Futures Trading Commission, COTs Timer, out-of-sample testing, walk-around testing
My latest signals table is now updated with the latest data based on this afternoon's Commitments of Traders report, which my trading setups are all built around. New signals: Nikkei goes from bearish to cash, and gold goes to bearish. Please note that my new Black Swan Risk-Control Rule is now in effect for all my trading setups based on the Commitments of Traders data issued weekly by the U.S. Commodity Futures Trading Commission. (See my "How It Works" page for details.) Trading new signals will resume Nov. 17. Have a good weekend.
TAGS: S&P 500, gold, Nikkei, COT, Commitments of Traders, derivatives, Black Swans, market timing, trading system development, CFTC, Commodity Futures Trading Commission, COTs Timer, out-of-sample testing, walk-around testing


Wednesday, 22 October 2008
Black Swan Rule Tweaked
Slight change to my Black Swan Rule - my new risk-control rule to deal with fat-tail risk. If the portfolio declines six percent in any four-week period, instead of closing all trades on the next weekly open, I will close all losing trades on the next weekly open and close winning trades if they experience a drawdown of greater than two percent. As I explained in a post yesterday, the new rule went into effect this week and I closed out all my trades, including one that was doing nicely. But in retrospect, I think it's better to give winning trades a little room to run. I explain the new rule and my other risk-control rules on my "How It Works" page
Tuesday, 21 October 2008
Bad Market! Time-Out
My newly created Black Swan Rule went into effect for all my trading setups this week. As I posted last week here, I've adopted this new risk-control rule in order to limit losses when markets are acting out of sorts in relation to the historic data. The rule is this: in any four-week period, if my portfolio experiences a loss greater than six percent (calculated using the weekly close values), I will close all trades on the next weekly open and cease trading new signals for four weeks. Think of it as a time-out for a badly behaving market. That was the case as of Friday's close. So my rule is to close all current trades and cease trading new signals. I will resume following new signals with the Commitments of Traders report for the week of Nov. 11. I will still keep updating my latest signals table and posting as usual during this time. Good luck this week.
Friday, 17 October 2008
Derivatives Data Bulls Banks & Crude
Hope you fared well this week. A few new signals today from my trading setups based on the Commitments of Traders data. Today's update on derivatives positions gives me bullish signals for the BKX Bank Index and crude oil, while my S&P 500 setup is going from a bearish signal back to cash. Note, however, that I'll be ignoring the two new bullish signals because both of those setups are on a four-week time-out due to my new Black Swan risk-control rule. (See this post earlier this week for more details.) See my latest signals table for more from the latest COT data. I hope to provide a more detailed update early next week. Have a good weekend.
TAGS: S&P 500, BKX, crude oil, COT, Commitments of Traders, derivatives, market timing, trading system development, CFTC, Commodity Futures Trading Commission, COTs Timer, out-of-sample testing, walk-around testing
TAGS: S&P 500, BKX, crude oil, COT, Commitments of Traders, derivatives, market timing, trading system development, CFTC, Commodity Futures Trading Commission, COTs Timer, out-of-sample testing, walk-around testing

Thursday, 16 October 2008
Black Swans: New Rule to Control the Risk of Fat Tails
If there ever was a Black Swan type of market, this is it. Statisticians call it a "fat tail." It's the kind of horror story that catches a lot of traders by surprise - markets doing crazy things that have little historical precedent and blowing all our data out of the water. Trader Nassim Nicholas Taleb wrote an excellent book about it called The Black Swan: The Impact of the Highly Improbable. He argued that markets don't work according to conventional rules of statistics and that surprising events - like we're seeing in today's markets - happen much more often than statistics would predict.
This brings me to a new risk-control rule I've been contemplating for a few weeks. It's my twist on a common trading rule: when your portfolio drops over six percent in a month, stop trading for the rest of the month. Until recently, I understood this rule to be mostly a psychological rule for a trader who is feeling messed up because of a string of losses that screw with your head and cause you to make more bad trades. I didn't see how it applies to mechanical trading.
In fact, I now see its real utility for me can be to control Black Swan risk. Here is my twist on this new rule I will be using. I call it the Black Swan Rule. It has two parts. One applies to the whole portfolio, the other to individual trading setups. (1) In any four-week period, if my portfolio experiences a loss greater than six percent (calculated using the weekly close value), I will close all losing trades on the following weekly open and close winning trades if they experience a drawdown of greater than two percent. I will also cease trading new signals for four weeks. (2) As well, I will cease trading any setup for four weeks that was stopped out because of a loss greater than the setup's past maximum drawdown. The idea is to give markets time to settle down and allow the data to come back into usual alignment.
The question is how to apply this rule now given the recent market craziness. I determined that my rule would have called for me to cease trading Sept. 22 for four weeks, with trading to resume next Monday. That would have helped me avoid much of the recent hurricane sweeping the markets. But since I didn't have this rule at that time, I am obviously still trading. In the latest four-week period, my portfolio saw a greater-than-six-percent decline as well. What to do? Here's my solution: I will check the situation after this week's close. If the last four-week period again shows a decline over six percent, I'll execute the Black Swan Rule for four weeks. For more details on all my risk-control rules, see my "How It Works" page. Good luck the rest of this week.
This brings me to a new risk-control rule I've been contemplating for a few weeks. It's my twist on a common trading rule: when your portfolio drops over six percent in a month, stop trading for the rest of the month. Until recently, I understood this rule to be mostly a psychological rule for a trader who is feeling messed up because of a string of losses that screw with your head and cause you to make more bad trades. I didn't see how it applies to mechanical trading.
In fact, I now see its real utility for me can be to control Black Swan risk. Here is my twist on this new rule I will be using. I call it the Black Swan Rule. It has two parts. One applies to the whole portfolio, the other to individual trading setups. (1) In any four-week period, if my portfolio experiences a loss greater than six percent (calculated using the weekly close value), I will close all losing trades on the following weekly open and close winning trades if they experience a drawdown of greater than two percent. I will also cease trading new signals for four weeks. (2) As well, I will cease trading any setup for four weeks that was stopped out because of a loss greater than the setup's past maximum drawdown. The idea is to give markets time to settle down and allow the data to come back into usual alignment.
The question is how to apply this rule now given the recent market craziness. I determined that my rule would have called for me to cease trading Sept. 22 for four weeks, with trading to resume next Monday. That would have helped me avoid much of the recent hurricane sweeping the markets. But since I didn't have this rule at that time, I am obviously still trading. In the latest four-week period, my portfolio saw a greater-than-six-percent decline as well. What to do? Here's my solution: I will check the situation after this week's close. If the last four-week period again shows a decline over six percent, I'll execute the Black Swan Rule for four weeks. For more details on all my risk-control rules, see my "How It Works" page. Good luck the rest of this week.
Tuesday, 14 October 2008
S&P 500, Nikkei Bearish Signals Stopped Out
While in Canada we enjoyed a long Thanksgiving weekend, I see this morning that big moves yesterday in U.S. and overseas markets would have caused my trading setups for the S&P 500 and Nikkei to be stopped out. Those setups had given bearish signals for this week's open (see last Friday's post, below), but I won't be putting on those trades this morning (our weekly open in Canada) as the moves on Monday took them beyond their stop levels as of the day's close. I would have sold the two positions on today's open. In fact, I may consider short-term trades in the opposite direction (long) in those markets during the duration of those signals, based purely on technical price action. Good luck this week.
Subscribe to:
Posts (Atom)